Flight Path Planning for a Cargo UAV
December 20258 min read
- UAV
- Path Planning
- Graph Search
- OSMnx
- Python
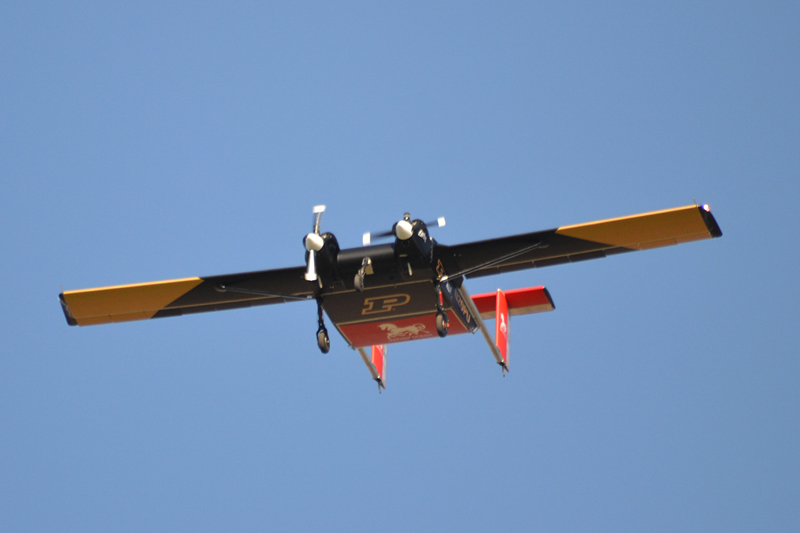
Navigation for the Windracers ULTRA, an autonomous cargo plane that hauls up to 200 kg of payload. A year of flight systems research with AIDA3, Purdue’s aviation AI center.
- Airport-to-graph pipeline. OSMnx turns any airport OpenStreetMap has mapped into a routable graph. O’Hare comes out as 6,209 nodes. The same code ran unmodified on LAX and Atlanta.
- Taxi routing. Closure rerouting around blocked nodes, plus a 71-waypoint gate-to-runway route under simulated ATC clearances.
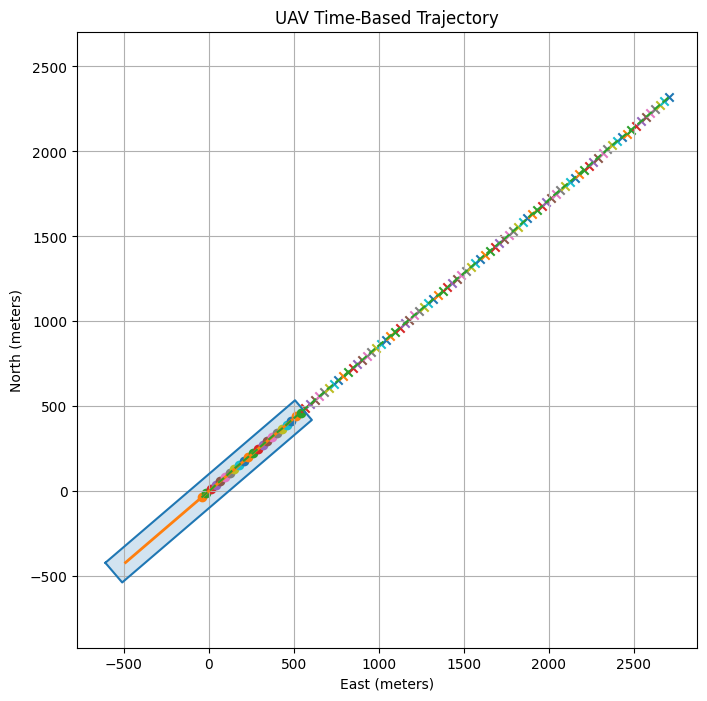
- Runway corridor geofence. Built from FAA endpoint data, 250 ft each side of the centerline, stress-tested with a wind-disturbed sim at 120 ft/s.
- From notebook to hangar. Gazebo sim first, then testbed flights in Purdue’s PURT hangar under Qualisys motion capture with live ROS 2 trajectory tracking.
O’Hare in 6,209 nodes, a runway in one yes-or-no check, and a foam airplane in a hangar to prove both.
In spring 2025 I joined AIDA3, Purdue’s Center on AI for Digital, Autonomous and Augmented Aviation, as a Flight Systems Researcher. The deliverable of a research position is whatever moves the aircraft closer to flying itself.
Context
The Windracers ULTRA is a fixed-wing autonomous cargo plane built for humanitarian delivery and wildfire monitoring. It hauls up to about 200 kg. Purdue’s airframe is named Earhart, after the aviator Purdue once employed, which might be the most Purdue thing possible.
The aircraft cannot hover and it cannot pull over. Once the takeoff roll starts, there is no calling it off. My work was the navigation problem, figuring out how the ULTRA gets itself around an airport.
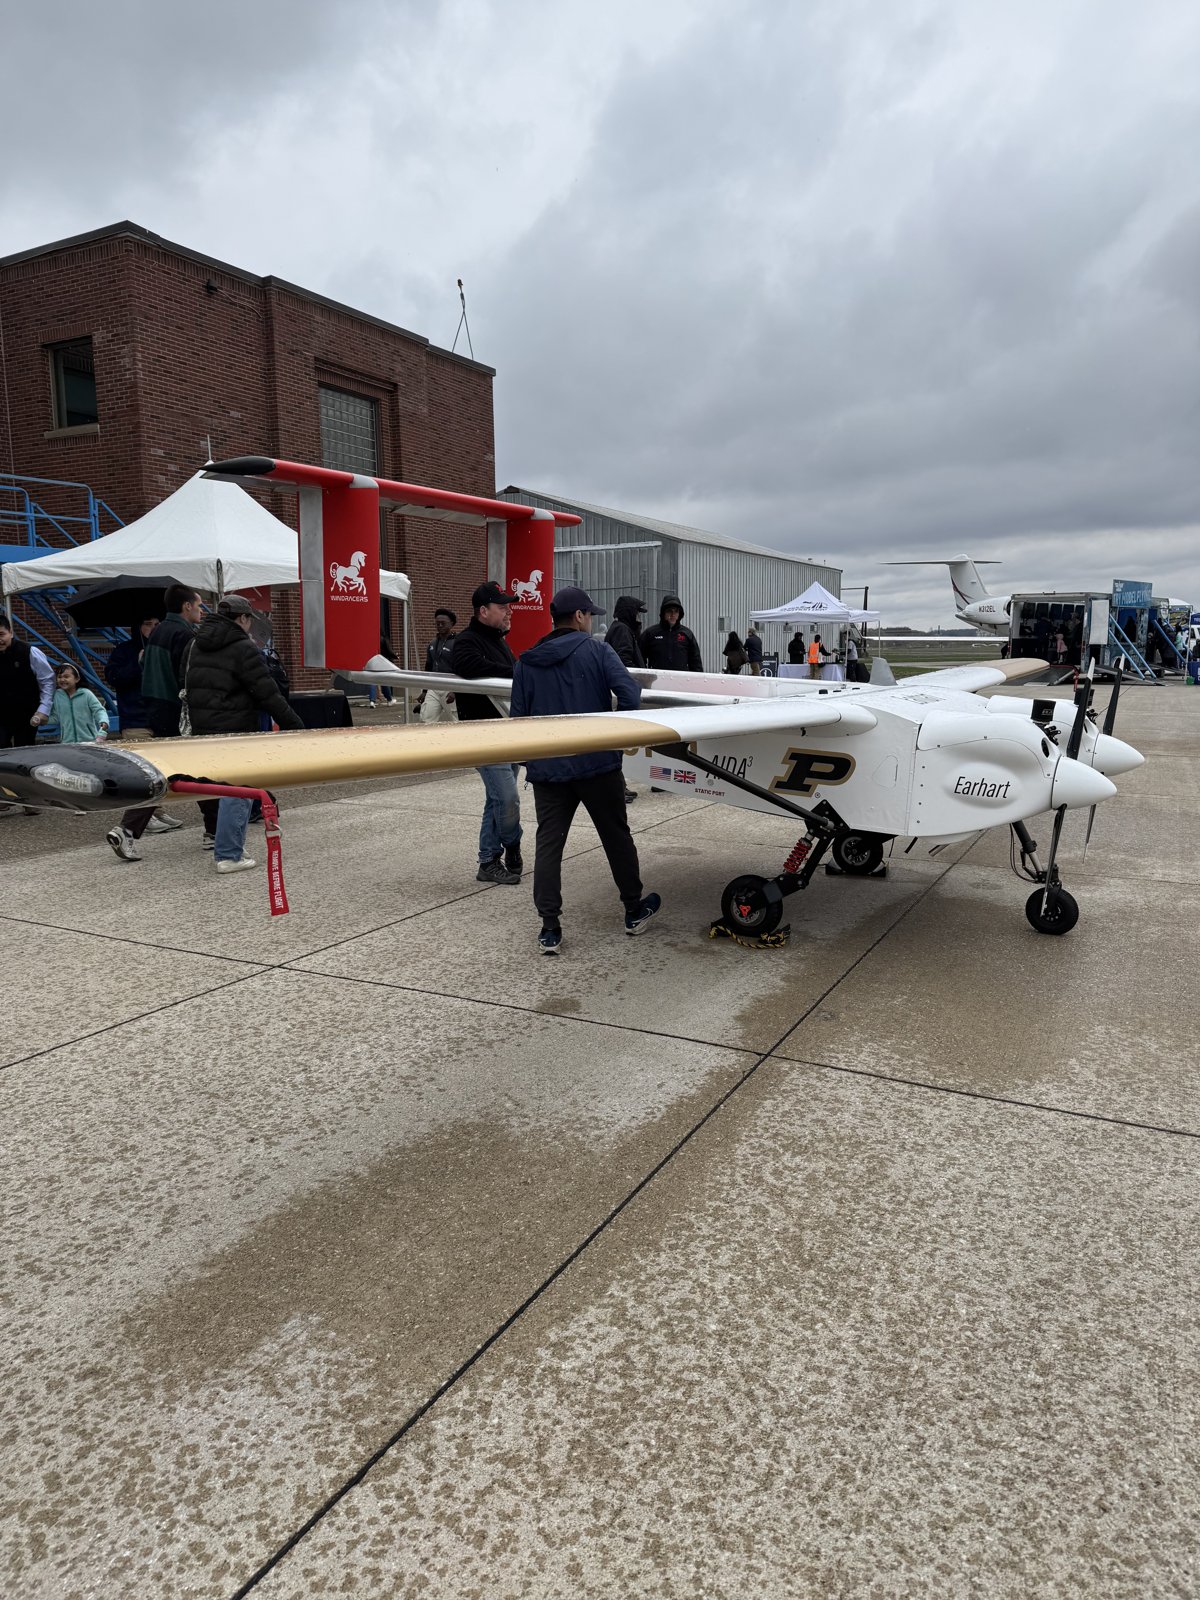
The spring semester started with a literature review. How does an aircraft know where it is while taxiing, without GPS? It is the same question my delivery drones run into. The short answer is lidar, and lots of it. Researchers in the field fuse lidar odometry, a running count of how far the aircraft has moved, with inertial data to track position with no satellite in sight. The newest papers at the time had neural nets reading motion straight from point clouds.
The Airport as a Graph
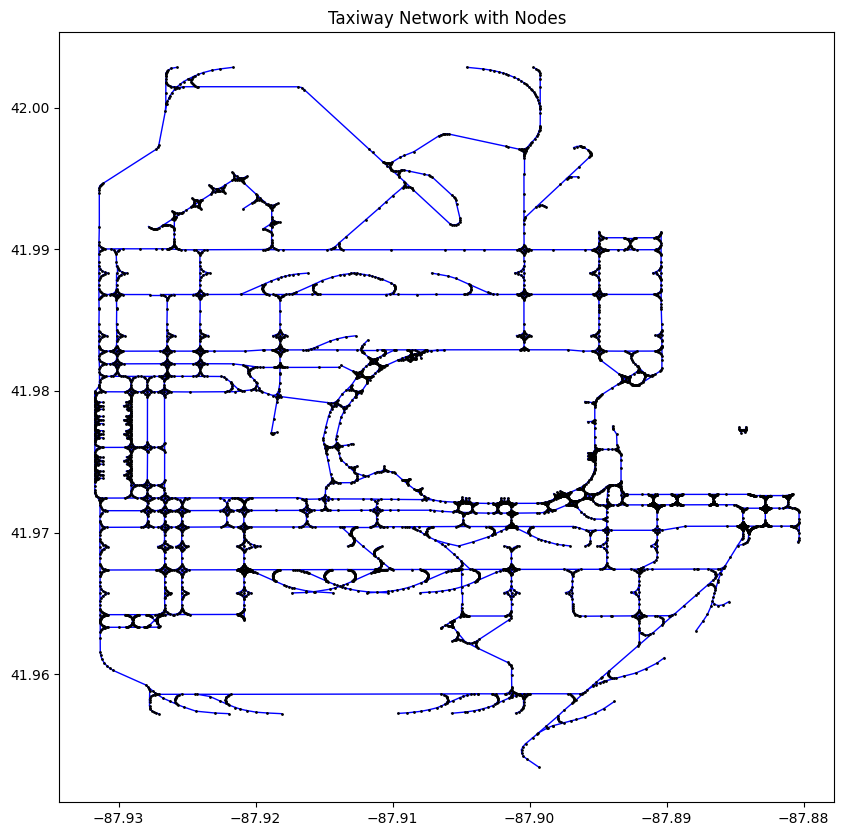
Before the ULTRA ever takes off, it has to taxi. An airport is secretly already a graph, with taxiways as edges and intersections as nodes. I built a pipeline that turns any airport in OpenStreetMap into one.
OSMnx pulls the geometry straight from OpenStreetMap. The pipeline chops every polyline into graph edges:
tags = {"aeroway": ["taxiway", "runway"]}
gdf = ox.features_from_place("O'Hare International Airport, Chicago, Illinois, USA", tags)

for line in gdf.geometry:
    coords = list(line.coords)
    for p1, p2 in zip(coords, coords[1:]):
        G.add_edge(p1, p2, geometry=LineString([p1, p2]))
O’Hare comes out as 6,209 nodes and 6,857 edges. LAX and Atlanta went through the same pipeline without a line changed.
With the graph in hand, routing becomes textbook graph search. Three things fall out:
- Runway checkpoints. My pipeline auto-detects each runway’s endpoints from the geometry, giving the planner defined start and finish lines.
- Closure rerouting. Block any node on the active route and the planner shrugs and goes around. The next step is a closure service that detects a blocked taxiway and updates the route mid-taxi.
- ATC simulation. A mock controller assigns a gate and issues pushback and taxi clearances. The planner then threads a 71-waypoint route from gate H3A/H3B to runway 4L/22R.
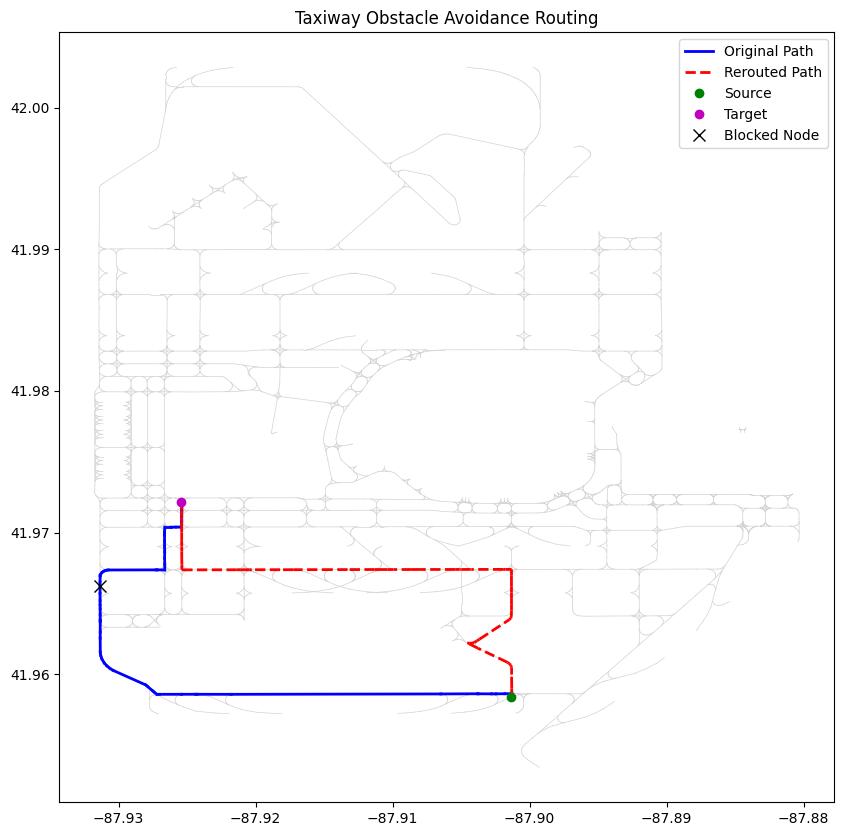
The prototype routes with plain shortest-path search. Next, A* looks for a smaller slice of the graph, LPA* repairs a broken route in place, and edge costs are weighted by real taxi speeds. A separate notebook parses real controller transcripts into structured commands, where “runway four left” becomes data and NINER collapses back to 9, which it always was. One day the planner should take its taxi clearances straight from the tower.
Staying Inside the Lines
Takeoff and landing hinge on one blunt question. Is the aircraft where it is supposed to be? My answer is a runway corridor, a geofence built from FAA runway endpoint data.
- Build. Take the published endpoints, buffer 250 ft to each side of the centerline, extend 300 ft past both thresholds.
- Convert. Map latitude and longitude onto a flat local grid in meters. The Earth is round. A runway is short enough to pretend otherwise, which makes the check plain 2D geometry.
- Check. One function call sorts any GPS fix as inside or outside. There is no “partially” on a runway.
I tested it with a simulated aircraft flying 120 ft/s (about 80 mph) down the centerline. Random wind gusts shoved it sideways and a proportional controller pulled it back. Because I classified every timestep, the run flagged the exact moment the aircraft left the corridor. The first airport I pointed it at was Purdue’s own field, runway 5/23.
Disturbance, correction, tolerance band. Once I noticed that loop, I see it everywhere. Funnily enough, it is also how I pour latte art at my other job.
From Notebook to Hangar
An algorithm that only lives in a Jupyter notebook has never been wrong in a way that hurts. So I moved it in stages. Gazebo first, the physics sim the flight code cannot tell from a real airfield, then real hardware. I ran flight tests with a lightweight autonomous fixed-wing UAV inside the Purdue UAS Research and Test Facility (PURT). The hangar and the aircraft belong to the lab. The test missions were mine.
The hangar is instrumented with a Qualisys motion capture system, which quietly solves the very problem the lit review chased. The mocap rig delivers position indoors at millimeter accuracy, with no GPS in sight. The full loop runs live:
- The testbed flies the mission while the mocap cameras stream ground-truth position.
- The ROS 2 stack, the software layer that carries data between the pieces, plots the flown trajectory against the reference path.
- A ground control station tracks the flight against the Purdue University Airport map.
One flight, three views. The testbed in the PURT hangar, the ground control station, and the ROS 2 trajectory tracking.
A crash here costs a foam wing and a re-flight. The same crash on the real ULTRA costs a $500k+ cargo plane.
Where It Stands
- Airport-to-graph pipeline, verified on O’Hare, LAX, and Atlanta
- Closure rerouting demo on the O’Hare graph
- Gate-to-runway taxi routing with simulated ATC clearances
- Runway corridor geofence stress-tested against a wind-disturbed sim
- Testbed flights at PURT under Qualisys mocap, after Gazebo sim runs
- A*/LPA* router and the live ROS 2 closure service
The Ultimate Takeaway
The taxi graphs, the closure rerouting, the corridor geofence, all of it was about closing the gap between the map and the machine. A 6,209-node graph is only worth building if a 200 kg airplane can fly the route that comes out of it.